10 States With the Most Fast-Food Restaurants Per Person, According to Data
If it feels like there is a burger joint, pizza place, or sandwich shop around every corner in some parts of America, the numbers suggest you may not be imagining it.
A published ranking of locations from 22 major restaurant chains found some states have far more of these familiar fast-food spots per resident than others. The analysis counted brands including McDonald’s, Subway, Taco Bell, Wendy’s, Burger King, Starbucks, Dunkin’, Chick-fil-A, KFC, Domino’s, Pizza Hut, Sonic Drive-In, and several others.
One important catch: this is not a count of every fast-food restaurant in each state. It covers 22 selected chains, excludes independent restaurants, and does not disclose the exact restaurant observation year or population estimate used. So think of this as a snapshot of major-chain concentration rather than a complete census of fast food.
Still, the results reveal some fascinating regional patterns. Here are the states with the highest number of locations from those selected chains per 100,000 residents.
Wyoming
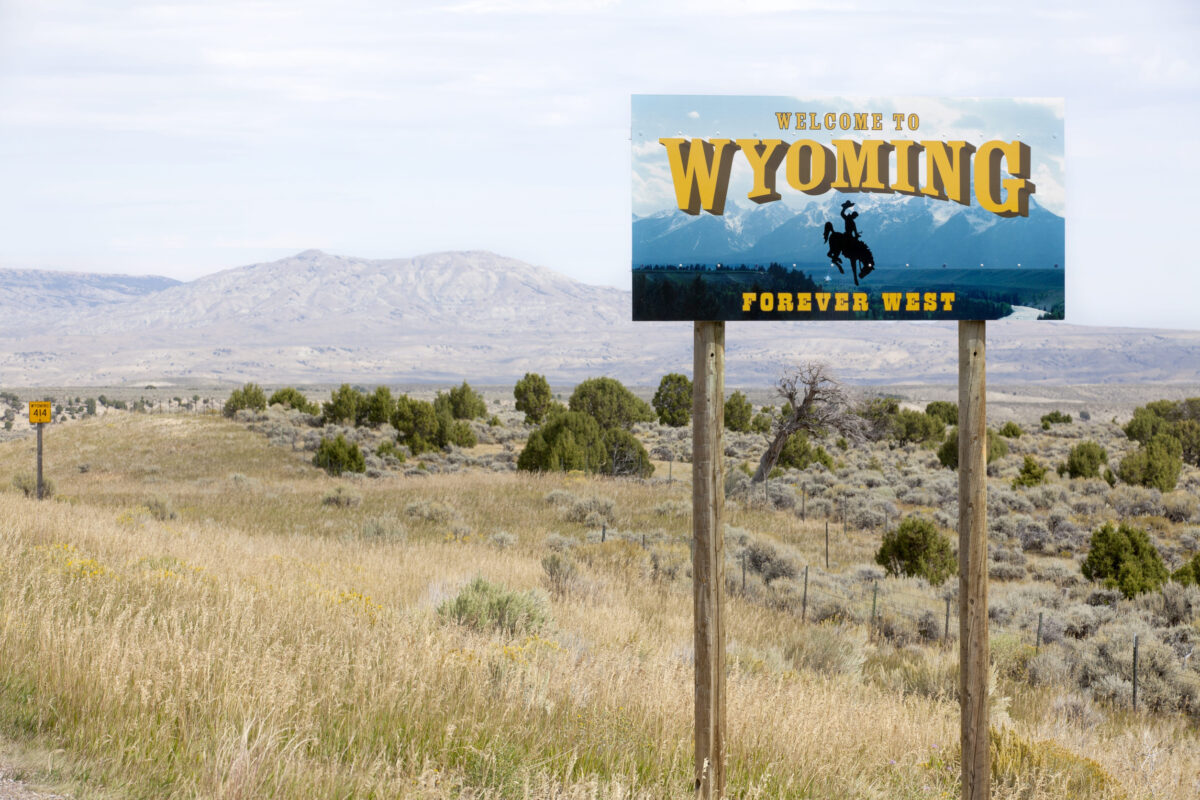
Wyoming makes the list with 44.34 locations per 100,000 residents.
The study counted just 259 locations across the 22 chains, making Wyoming the state with the smallest absolute number of restaurants among the states featured here. Its relatively small population, however, helps push its per-capita rate much higher.
Subway was especially prominent in the study, accounting for 59 locations. That worked out to just over 10 Subway restaurants per 100,000 residents.
Tennessee
Tennessee recorded 44.72 locations per 100,000 people and 3,187 locations overall.
One familiar roadside name stands out here: Sonic Drive-In. The study counted 228 Sonic locations in Tennessee, giving the state the third-highest total for the chain in the dataset.
Interestingly, Tennessee had slightly more restaurants in raw numbers than Indiana, which ranks higher. That is a good reminder that this comparison is about restaurants relative to population, not total locations alone.
Louisiana
Louisiana recorded 45.41 locations per 100,000 residents.
The study counted 2,077 locations from its selected chains. Subway, McDonald’s, Pizza Hut, and Popeyes were among the most commonly represented brands in the study.
In a state known for its distinctive local food culture, Louisiana’s results show that traditional restaurants and national chains can occupy very different parts of the same dining landscape.
Related: 10 US states facing the fastest-growing crime crisis
Arkansas
Arkansas had 46.19 locations per 100,000 residents.
The study counted 1,417 locations across the selected brands. One interesting detail is that its dataset included four Whataburger locations, although that historical figure should not be treated as the chain’s current Arkansas store count.
Even so, Arkansas sits comfortably above the reported study-wide average of 38.76 selected-chain locations per 100,000 residents.
Indiana
Indiana recorded 46.37 locations per 100,000 people.
The state had 3,182 locations in the study. Among the individual brands highlighted were 353 McDonald’s restaurants, 198 Dairy Queen locations, and 190 Burger King locations.
Those numbers help explain why familiar national names can seem particularly visible along Indiana’s highways, suburbs, and commercial corridors.
Ohio
Ohio is an interesting case because it has the highest raw restaurant count of any state on this list.
The study counted a whopping 5,472 locations, while Ohio recorded 46.43 locations per 100,000 residents.
The analysis also included 519 Starbucks locations in Ohio. That matters because this study included coffee chains, making its definition broader than federal classifications of limited-service restaurants.
Mississippi
Mississippi recorded 46.71 locations per 100,000 residents.
The study counted 1,373 locations in the state. Sonic Drive-In, Wendy’s, and Burger King alone accounted for a combined 307 locations in the dataset.
Mississippi also contributes to a noticeable regional trend in the rankings: Southern states appear frequently near the top.
Kansas
Kansas had 47.10 selected-chain locations per 100,000 residents and 1,385 locations overall.
Pizza lovers may find one detail especially interesting. Pizza Hut was reported as the state’s second-most-common included chain, with 165 locations. Domino’s and Papa John’s together accounted for another 75.
Kansas also finishes extremely close to Kentucky, with only 0.11 locations per 100,000 separating the two states.
Kentucky
Kentucky recorded 47.21 locations per 100,000 residents.
Its total of 2,137 selected-chain locations is considerably larger than Kansas’ total, although their per-capita rates are almost identical.
Subway had a particularly strong presence in the study, with 362 locations statewide, including 52 in Louisville. Because the study does not disclose when it collected its restaurant locations, these figures are best treated as study-era counts rather than current totals.
West Virginia
West Virginia had the highest rate in the study.
The analysis reported 868 selected-chain locations, or 49.04 locations per 100,000 residents.
Subway led the way with 164 locations, followed by McDonald’s with 104 and Wendy’s with 72.
West Virginia’s relatively modest raw restaurant count shows exactly why per-capita rankings can look so different from lists based purely on total stores. A state does not need thousands of restaurants to rank highly if it also has a smaller population.
Related: 12 Most Controversial States in America
A Clear Regional Pattern
The most interesting takeaway is where these states are located.
Six are in the South: West Virginia, Kentucky, Mississippi, Arkansas, Louisiana, and Tennessee. Kansas, Ohio, and Indiana are in the Midwest, while Wyoming is the only Western state represented. No Northeastern state appears.
That does not prove people in these states eat more fast food. It simply shows that the 22 chains included in this particular analysis had a higher concentration of locations relative to population there.
Different definitions can also produce dramatically different rankings. Another 2025 analysis using broader Census restaurant data placed Hawaii first in limited-service restaurants per capita. That contrast shows why the methodology matters just as much as the headline number.
So, while West Virginia comes out on top in this 22-chain comparison, the bigger lesson may be simpler: when someone says a state has the “most fast food,” it is always worth asking exactly what they counted.